Under the Golden Gaffe the market for lies and bullshit has never been stronger:
When sliding down the slope of dope, the lies and liars have to keep getting dumber and dumber. The next thing you know, the entire circus is led by a sociopathic liar.
For the past year, pot stocks have been a fantastic market timing device. Timing a -10% decline last February and another -20% decline in the fourth quarter. Following the pattern, would bring a -40% decline this time around. I suggest with substantial risk to the downside. Gamble at your own risk.
"The prevailing mood has shifted from extreme pessimism to extreme optimism"
As it was in 2018, when copious fools bought into the greatest 'Conomy ever, only to see global risk assets crash. Now, amid exact opposite conditions, they are told the exact same lie:
"The United States economy should grow by another 3 percent in 2019, despite some disappointing indicators that kicked the year off...Hassett also addressed the surprise many taxpayers are feeling this season thanks to the new federal tax law...the Treasury Department already adjusted withholdings last year so that people would see the tax cuts "right away."
"The fact is that people got their tax cuts tax refunds and they were visible in their checks last February. And that's one reason why we had a 3 percent year in 2018"
In other words, we plundered 2019 GDP to artificially inflate 2018 GDP, which is why this year will be the same:

Speaking of new all time lies:
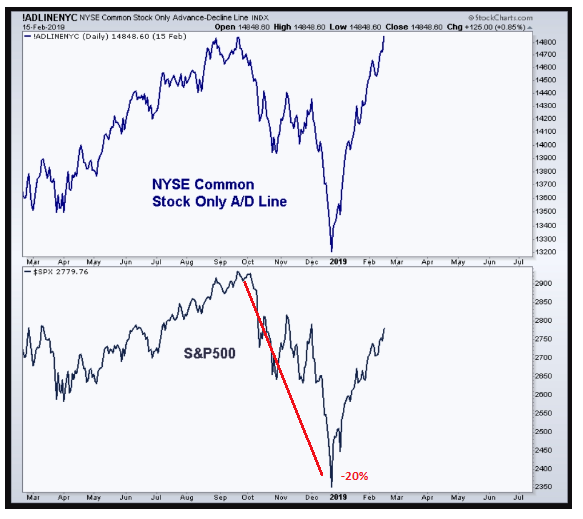
“Bear markets never, ever, ever begin when the A/D line is making an all-time high.”
Those are strong words, so I looked around to see if there was a time when the market fell 20% or more when the A/D line made a new all time high. And I found an example. Right on the same chart they used in the article.
In other words, the last time the A/D reached this exact same level (September, 2018), is when the bear market started:
In other words, the last time the A/D reached this exact same level (September, 2018), is when the bear market started:
Who is writing this shit, Stevie Wonder?
NYSE Common Stock Only A/D Line (black)
% NYSE above 200 dma (red)


