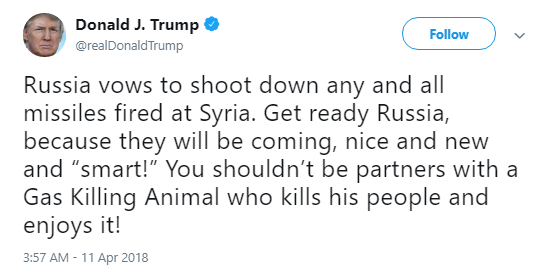
If starting trade wars on Twitter was bullish, starting real wars must be even more bullish:
As we see on the chart below, the battle for the 200 day has so far lasted 2.5 weeks. The battle for the 50 day (blue) lasted four weeks. The three-wave overlapping form is clear for both counter-trend rallies. Much ado about nothing. The current rally clearly far weaker. From a social mood perspective, everyone knows that trade wars are a buying opportunity. When that level got bought but ended lower it was on to buying WWIII. This would be the first hot war between the two nuclear powers in history.
But, the sheeple are too stoned to take notice. In other words, "I'll have what they're having"...
Six months to nowhere...
On a daily chart, here we see the highest momentum stocks have carved out a perfectly symmetrical head and shoulders top.
Currently at the same level as mid-October despite above average volume.
Here is where it gets interesting from a social mood perspective. Despite the compounding risks, deteriorating breadth, and downtrend, complacency is the same as it was at the record high in January.
Pure delusion
With respect to volatility, the weakness in large caps highly evident in the first chart above (lower pane), is also showing up in relative volatility:
Zooming out, the Dow has the same problem - a cascading waterfall lower in broad daylight.
The World Leaders Index (200 largest global companies) is back-testing the 35 week moving average (200 day):
"Global economic growth slowed sharply to the weakest for over a year in March. The JPMorgan Global PMI™, compiled by IHS Markit, fell for the first time in six months, down sharply from 54.8 in February to a 16-month low of 53.3. The 1.5 index point drop was the steepest seen for two years."


