“All in all, the rally in developed market equities over the last three months has been clearly led by stocks with the shakiest fundamentals,”
Really, you're going to make me keep going...
All of the ingredients for a crash are in place, except one - trend reversal on the Nasdaq aka. junk stocks, which I discussed yesterday. I have identified what appear to be the key factors leading to vertical crash of the likes seen in August 2015 and January 2016:
Liquidity outflow, reversal of the stock/bond ratio, carry trade unwind, breadth rollover, new highs contracting, trend reversal.
Liquidity outflow is a function of strong opens and weak closes, the hallmark of a bear market:
For the stock/bond ratio, I focus on the consumer staples dividend stocks relative to 30-year ETF:
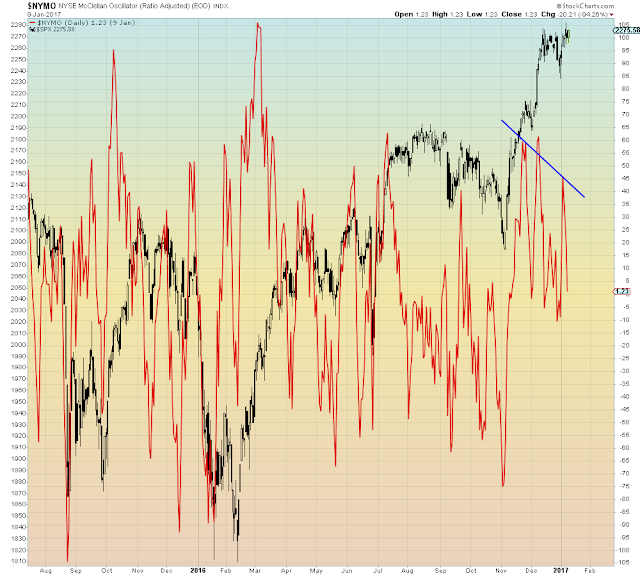
Breadth is the NYSE momentum oscillator which uses the advance-decline line as its underlying variable:
Some prefer On Balance Volume which is more of a measure of liquidity:
On-balance volume (OBV) is a momentum indicator that uses volume flow to predict changes in stock price
This ~115 level on USDJPY appears to be all-critical to the global risk rally:
On-balance volume (OBV) is a momentum indicator that uses volume flow to predict changes in stock price
This ~115 level on USDJPY appears to be all-critical to the global risk rally:
I use total market new highs, which is across all U.S. exchanges:
Here is where it gets down to the wire: trend change
The Dow and the S&P both appear to have rolled over, and the S&P just finished filling yesterday's open upside gap. Whereas the Nasdaq just made a new high.
Therefore, as I indicated yesterday on the longer-term chart, it all comes down to the QQQ / Dow ratio which could reverse any time now...
Mind the gaps:


