This 1-month spread (red line) is coincidentally ALREADY equal to last month's expiration spread (blue line). It's an indication of how much guaranteed pain will be incurred by anyone long "oil" going into expiration...

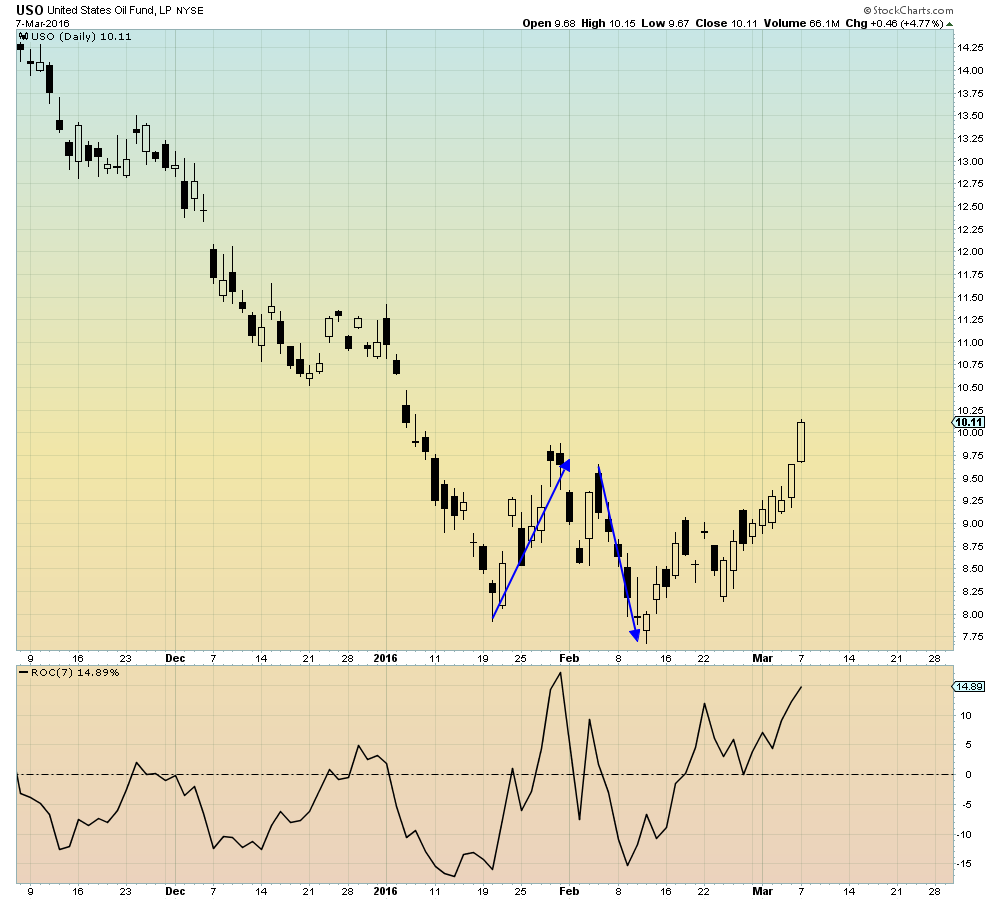
In other words, the "pre-game" short-squeeze in oil is making the inevitable outcome i.e. vertical drop that much worse. Oil dropped -20% in 6 days last month to rediscover "the market" at rollover/expiration...
Deja Vu:
US Oil ETF:


US Oil ETF:
The minimum loss to be taken by USO oil ETF holders is already known in advance - it's the spread between the current month (April) and next month (May) futures contract. Currently, it's indicating a guaranteed ETF loss of -5% at current levels. However, we know that the futures price will be marked to the ocean at Cushing by March 22nd, therefore, we know that the full loss to be taken between now and expiration will be far larger...
Here's what we know. The last 1-month spread (blue line) was $3 at rollover and $1.92 at expiration (circled). Meaning that *anyone* aka. the USO ETF that rolled over between those two dates took a ~7% haircut relative to $30 crude. In addition to the even bigger haircut they took leading up to rollover.
The red line is the current 1-month spread. It's already a chasmic $1.92, implying at least another 5% haircut for the ETF this month. The exact same pattern played out in 2009 - shorts took vertical pain to get realized gain.
Note that the spread (red line) is already widening, meaning anyone long oil futures is already fleeing the current contract...
Realized gain/loss visualized:
The USO:WTI ground and pound:
As the above futures charts indicate, the ETF realized a -7% drawdown just between rollover and expiration last month:
The USO:WTI ratio (red) with WTI (black):
The USO:WTI ratio (red) with WTI (black):
