Five years of wasted time and wasted money, masking the steady deterioration in the underlying economies. Propping up lenders with cheap money while borrowers become ever-less solvent in the meantime, is the dumbest fucking idea in the history of mankind - aside from giving time for the ultra-wealthy to move their assets offshore.
All while the stoned Idiocracy was occupying the couch, the fridge, and the TV set...

1) Debt sponsored global pseudo-recovery, now in its sixth year (see below)
2) Fed now draining liquidity - currently less than half of its peak $85 billion/month to $35 billion - today indicating that interest rates will rise sooner rather than later
3) The most overbought U.S. stock market in over 20+ years (likely ever)
7) Perfect correlation (1) across all risk assets
9) Lowest trading volumes in fifteen years
10) HFT controlled market, prone to daily glitches
11) Mass complacency
12) Zero hedging of any kind whatsoever
Greedometer Update
You may recall the Greedometer is based upon several of the factors mentioned above and some others, specifically: Options Volatility (VIX), profit margins, investor sentiment, margin debt, options ratios, insider selling, economic leading indicators, market breadth, valuation (P/E), buying climaxes
The last reading of this gauge (December 2013), showed an historic level of risk (red line):

However, like the rest of us skeptics, this fucking gauge kept giving false positives, skewed as always by Central Bank policy intervention, which led to a certain amount of inevitable frustration. So what this guy did is instead of charting the greedometer sequence each time, he went to the second derivative and instead charted the occurrences of extreme readings. This is the amazing part, as he mentions, the signals given by the Greedometer are occurring at ever shorter intervals, observing an "exponential time decay function" approaching: zero:
The left scale are the # of months, the bottom scale are the instances of extreme readings. The last "iteration" of course is marked "I7" and is concurrent with this month aka. "June":

In other words, this could all go on "forever" or end tomorrow. You know how I am betting - i.e. like the Greedometer above, I assume that asinine behaviours repeated over and over again, have a habit of ending extremely abruptly
The IPO Market in aggregate
IPO Mutual Fund
The "animal spirits" are waning. Wall Street's ground and pound on the ETraders is taking its toll...

The IPO Market in aggregate
IPO Mutual Fund
The "animal spirits" are waning. Wall Street's ground and pound on the ETraders is taking its toll...
Momentum (50 Day Moving Average)
Not necessarily what one would expect at an all time high...

Coiled Spring
Daily Momentum

Not a good time to fall asleep...
Small Caps versus S&P

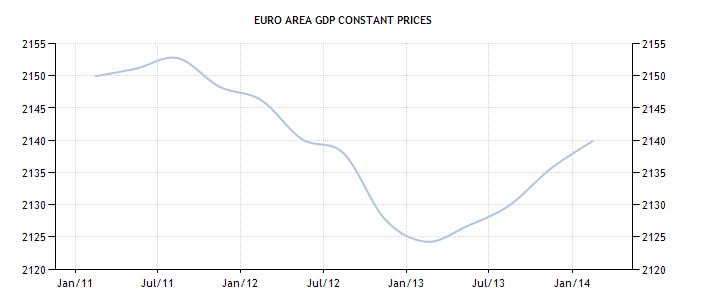
Euro Area Pseudo-Recovery
Since I've been talking about the U.S. illusion-formerly-known-as-the-economy, I thought I would switch gears:
Euro Area Unemployment
Seems to be going in the wrong direction for a "recovery"

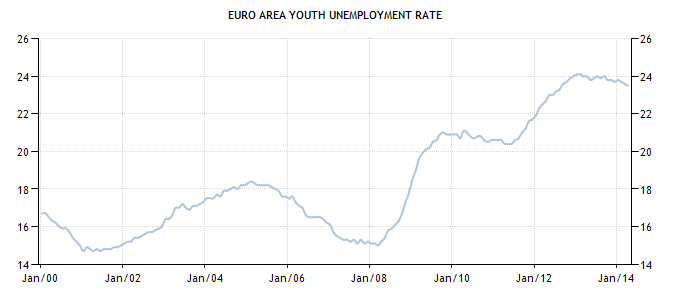
Youth unemployment
Slight downtick while still at Depression levels
"GDP"
Government Debt aka. true "GDP"

If this is a fucking "recovery", then perhaps some translation is in order...