The graph below shows the numbered red lines indicating each double-top. Red up arrows show the head and shoulder bottoms (I only show the largest two fractal bottoms).

Extreme sentiment refers to the AAII and II sentiment surveys which are at similar extremes reached in October 2007 and April of this year. As well, the ISEE call/put ratio printed 183 yesterday, the highest level since April 15th (just prior to the top).
The below close up view of this year's action shows the (2) and (3) fractals:

To summarize, the first double-top rally (from 2003-2007) took ~5 years to reach extreme sentiment and a peak. The rally from March 2009 to April 2010 lasted just over one year and reached a similar extreme in sentiment and a market peak. The rally from the low this past August to this November's high, lasted 2.5 months, peaked, triple-bottomed earlier this week and is now straight vertical, having already again reached an extreme in sentiment.
Each rally is of shorter and shorter duration than the last yet attends the same level of investor enthusiasm. Why are investors equally bullish as October 2007 when the market is 20% lower? Why are they equally bullish as last April when the market has gone nowhere?
This effect is called attenuation, the same concept used in electrical engineering to describe a loss of signal. Or the term used in cardiology to denote the heart's pattern immediately prior to a heart attack...
By the way, for those who do not subscribe to EWI (literally or figuratively), their most recent "December Financial Forecast" sees as the most likely scenario higher prices going into year end, leading to a final top above current levels. For the most bearish of all published forecasters to have now switched from being full on bearish since April expecting the market to top out imminently, to now being bullish (at least intermediate) term, I regard that as capitulation. Maybe they will be right this time, but since they have been wrongly bearish for the better part of a year, I am not betting that they will now get it right. More likely they will be the last fools sucked in at the top, too focused on their ever-changing wave counts and ignoring all other flashing indicators including their own capitulation. Given that they alter their wave counts continuously after-the-fact, we can be confident they will be "right" eventually, that's guaranteed.
Dr. Bernanke in the house: When all you have is a hammer, everything starts to look like a nail
Meanwhile, in other news, today's jobs report was far worse than "expected". With 39,000 net new jobs created v.s. 150,000 expected and 250,000 minimum needed to offset new entrants to the labour force.
Copious disinformers still abound to support Bernanke's QE2 (Money printing) scheme, which has done nothing for the real economy to date (hence the v.2 nomenclature, soon to be 3,4,5...) Those supporting this scheme tend to be of the Wall Street ilk and thereby the primary beneficiaries of being able to borrow at 0% and lend at 4%, risk free - via the various carry trades enabled by this "policy" of basically giving out free money to select wealthy investors at the public expense. As we have seen before, all of this extra financial leverage makes for extremely spectacular busts when these carry trades are unwound.
Speaking of which, we learned this week that the Fed extended a total of $9 trillion in loans to the banks during the banking crisis - $9 fucking trillion ! Do you remember all of the hand wringing, Tea Partying, letters to Congressmen that abounded when the Treasury initiated the TARP program in Sept. 2008? Yet, for all that, the $700 billion TARP was less than 10% of what the Fed doled out - it was chump change. The Fed on the other hand, faced absolutely zero oversight or intervention while extending the U.S. balance sheet several times beyond historic levels.
2008 was a tremor, next comes the earthquake
What has the Fed done in the meantime to correct the imbalances and mal-incentives that led to the 2008 financial crisis? All they have done is to further leverage the system by inventing new ways (Quantitative Easing) to put money in the hands of leveraged speculators and thereby kicked the can a few yards down the road towards the next much larger catastrophe. The odds that the Fed can kickstart the economy and engineer a successful exit strategy by applying even more of the same easy money that caused the first crisis, is exactly fucking zero.
The Fed is run by a bunch of overeducated moronic stooges toiling feverishly at the behest of their moneyed puppetmasters on Wall Street. Harvard and the University of Chicago do not teach any courses on judgement and commonsense, which is why there are so many fucking morons in high places pissing all over themselves while the fire burns out of control.
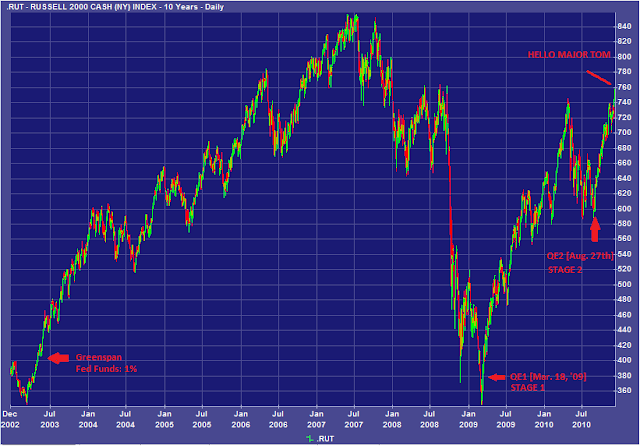
The stock market chart below illustrates the only true beneficiaries of Monetary Policy. On the far left, Greenspan's 1% interest rate policy [June 25th, '03] (at the time, the lowest in U.S. history), that propelled the 2003 "Mission Accomplished" rally and led to the parabolic housing boom that is still negatively impacting a large number of households. On the right side, Bernanke's Moon Shot showing Stage 1 [QE1], Stage 2 [QE2] and our current juxtaposition, once again in Outer Space. Oddly, charts like this don't make me optimistic:
2008 was a tremor, next comes the earthquake
What has the Fed done in the meantime to correct the imbalances and mal-incentives that led to the 2008 financial crisis? All they have done is to further leverage the system by inventing new ways (Quantitative Easing) to put money in the hands of leveraged speculators and thereby kicked the can a few yards down the road towards the next much larger catastrophe. The odds that the Fed can kickstart the economy and engineer a successful exit strategy by applying even more of the same easy money that caused the first crisis, is exactly fucking zero.
The Fed is run by a bunch of overeducated moronic stooges toiling feverishly at the behest of their moneyed puppetmasters on Wall Street. Harvard and the University of Chicago do not teach any courses on judgement and commonsense, which is why there are so many fucking morons in high places pissing all over themselves while the fire burns out of control.
The stock market chart below illustrates the only true beneficiaries of Monetary Policy. On the far left, Greenspan's 1% interest rate policy [June 25th, '03] (at the time, the lowest in U.S. history), that propelled the 2003 "Mission Accomplished" rally and led to the parabolic housing boom that is still negatively impacting a large number of households. On the right side, Bernanke's Moon Shot showing Stage 1 [QE1], Stage 2 [QE2] and our current juxtaposition, once again in Outer Space. Oddly, charts like this don't make me optimistic:

The other beneficiaries of Bernanke's doomed munificence are silver and gold investors, who will ride that bullet train until it crashes and burns:
So, do you feel lucky, punk?

These silver investors are seeking shelter from "inflation" even as the core CPI prints its lowest reading ever (since data collecting started in 1957). Check out this chart. Wow, that's inflation all right ! Silver investors tell us that core CPI is inaccurate and does not reflect true costs of commodities and precious metals.
Let's see, inflation is "going up", so buy silver. Silver is going up, therefore inflation is going up ! Buy more silver!
Hi Ho Silver, Away !!!!
Hi Ho Silver, Away !!!!
;-)